Budget Report with Visual Pie Charts PowerPoint Template
Budget Report with Visual Pie Charts PowerPoint Template created in a modern design to fit modern businesses. If you are looking for a way to present your budget report, look no further with this PPT template you will have a unique visual tool to accomplish that.
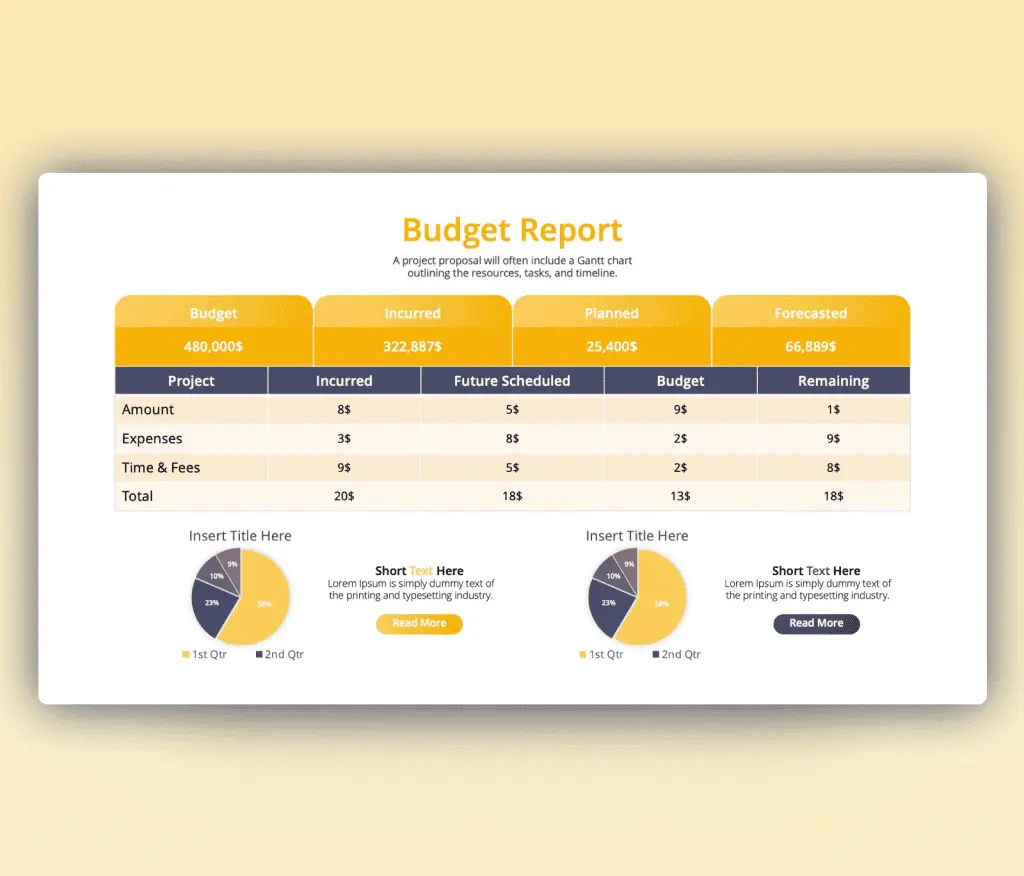
We all agree that the budget and financial flow in any institution are sensitive data to deal with and it is really important to find a way to communicate it with others. This budget presentation PowerPoint slide is a great way to present and reflect on your Budget data using pie charts as the perfect tool to demonstrate the budget actual transactions.
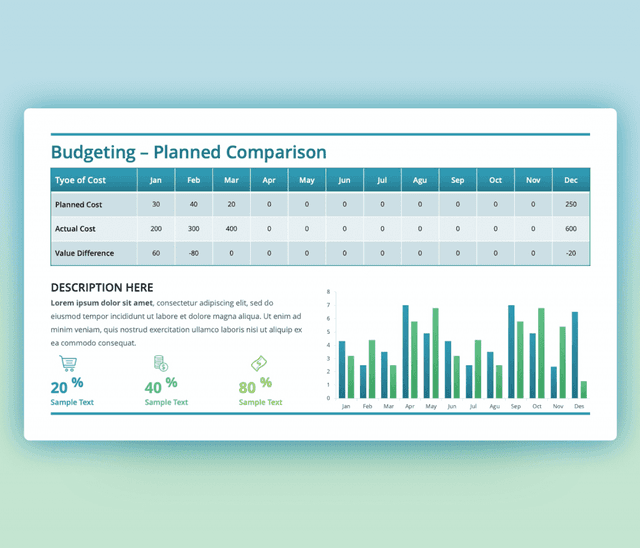
As seen in this performance budgeting ppt There is a table for
- Budget Incurred
- Budget Planned
- Budget Forecasted
Each column meets the rows of (Amount, Expences, Time& fees, and The Total). Then at the bottom, there are two pie charts to help you compare between forecasted budget to share information in a transparent perspective.
This Budget Report with Visual Pie Charts PPT is fully customized, you can create a whole new look. Starting with changing these yellow and blue colors themes choosing a new mix from the available color palettes. All icons are vector which means you can adjust the table to fit your data and the pie charts to demonstrate it. Fonts can be changed to fit your style. As it is a budget PowerPoint template, it is easy to edit it around and use it multiple times for different situations.
- Download free budget ppt templates