How and Why to Use Dashboards + Top 18 Dashboard PowerPoint Templates!
Dashboards PowerPoint Templates are a great way to present and reflect on data and comparing results and tracking performance. In this blog post, we will tell you how best can you use Dashboards in your presentations and we will introduce some of our brilliant dashboards PowerPoint templates.
Visual tools are known to be a great way to be more descriptive and direct when it comes to sharing information with others. Pioneers who are trying to reach the best results in business understand that it’s important to pick your tools right to make it efficient when you communicate a presentation can be and how much it could worth especially if they are looking for investment or reporting for higher management.
Before getting to our Dashboards PowerPoint template we will first share Five reasons why You need to use Dashboards and Five Guidelines when working on them, so let’s jump to it!
Reasons Why You need to use Dashboards while presenting:
- ProvidingTransparent data: In business data is complicated and tangled in general, Dashboard templates give you a chance to access and understand your data.
- Providing accessible data: using dashboards help you probably to have immediate access to an overview of your performance that helps you track and analyze.
- Make it better decision-making: Having an overall look at your data across your business. Gives you a clear vision on the state of your business which makes it more effective for you to make a decision.
- Accountable data: Accessing real data reflects on the good and right events and what is happening wrong. It provides real data that you can count on and makes it easier for your team following.
- Interactive Experience: Dashboard is a tool that digitizes your numbers and gives logic to how things go. It gives a dynamic flow of how to use this data.
Five Things to consider while Using Dashboards
1- Understand your KPIs: Simply, The fact that you are creating a dashboard or using a one, means you are measuring something. To have the best results you need to understand and state the Key Performance indicators that you will reflect on.
2- Talk to Your executives: Agreeing on what your executive needs to see on dashboards is important to help you stay on track, Data is a huge amount of information that you don’t need to mention all. So sharing a sample with your executive and deciding on what you will exactly work on is a really important and saving tip.
3- Keep it simple: As we now all know that dashboards can be pretty confusing, sharing numbers, charts, and tables that may make others get lost. When sharing and creating dashboards its important to make it clear and direct that this is what your viewers need to know.
4- Get your answers first: Questions are the way to know what is going on, so asking the right questions seems to be a smart step to create your content. Such as
- Who is my audience?
- What do they need to know out of this dashboard?
- Why they need this dashboard?
- How they will consume the information you are providing?
5- Help the viewer of the dashboard through: You can Starting with clearing things out, telling what every chart means. Addressing what this dashboard is about. What they should expect along with the presentation. Break down the complex of data.
Now to the Dashboard PowerPoint templates that will help you create and innovate. We are working on inspiring you to combine your data, organize it, and implement what you understand to get the best instant results.
Dashboard Powerpoint Presentation Templates:
Financial Dashboard for Reporting in a PowerPoint format. Dashi’s financial dashboard presentation empowers you to share your numerical results in an effective way. All are included tables, infographics, and timeline slides.
The marketing field is full of tracking and analyzing, arrange your data, and presenting it is another level of implementation. Our dashboard PowerPoint template for marketing helps by providing a wide range of designs.
SEO Dashboard PowerPoint template is highly needed. As a specialist in this field, it gets really complicated, that need tracking for your keywords and how their performance.
Despite that different social media platforms have metrics, dashboards, and calculations to give a clear vision to the user and tell the story of your brand but using professional and versatile dashboards designs gives you a way more important results.
Dashboard KPI PowerPoint Report Presentation is a direct design that involves metrics, KPIs, and project status. As a tool, dashboards PowerPoint templates track and visuals performance and measure your key indicators very effectively.
Sales Dashboard Report PPT Presentation includes different layouts for sales performance and reporting. These dashboard templates help you present professional insight into your business and management.
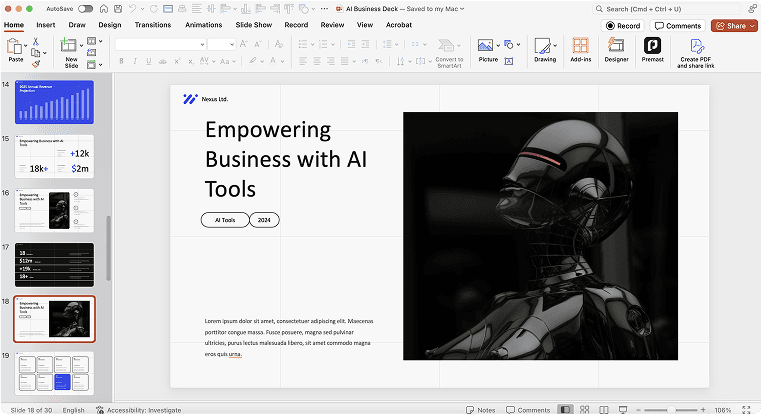
Premast Free dashboard PowerPoint template to fit multiple businesses with metrics and KPIs measurement. You can use it to track your projector or as a sales dashboard.
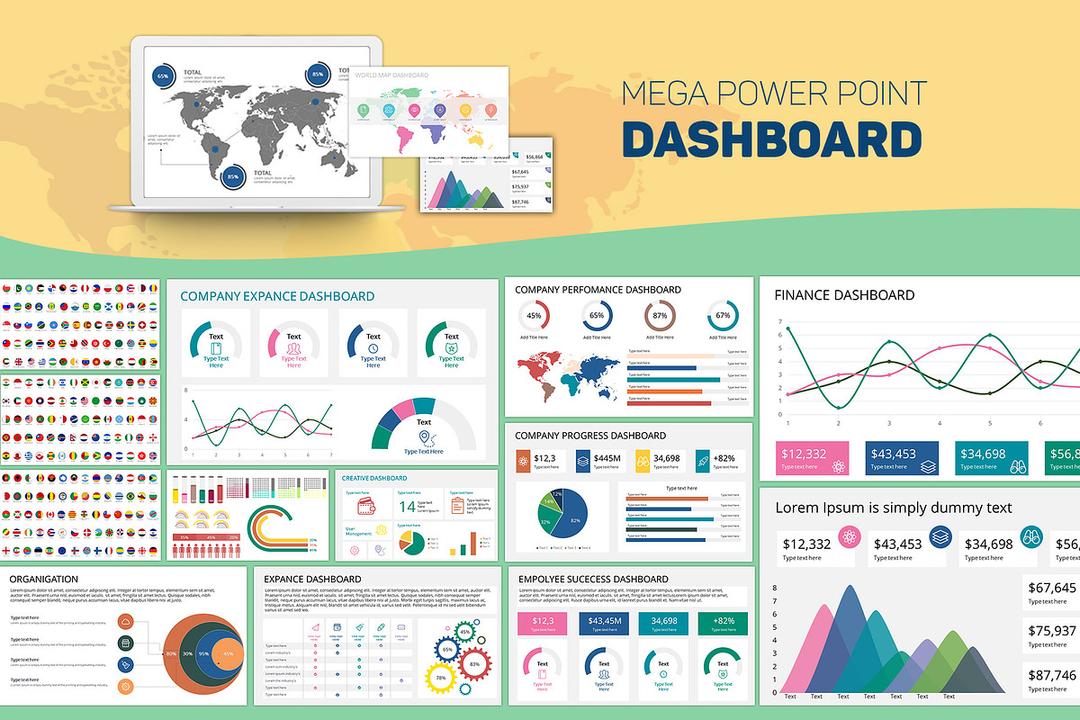
This iconic & amazing Dashboard Creator ppt comes with multiple prebuilt simples, a full editable dashboard template, and assets such as icons, maps, flags, and charts using which you can simply craft your designed dashboards which will make your presentation shine.
Website Dashboard Presentation Template is a Powerpoint template that is perfect for both your business and personal use. With this animated ppt template presentation, you will be able to make a dynamic presentation that will captivate your audience focusing on creating great dashboards layouts.
Dashboard Pack – Multipurpose Dashboard Asset PowerPoint Presentation is the all-in-one best option for sales pitching deck, social media analysis display, educational seminar, and the other custom mixing purposes. It is versatile and you can use it pretty much in different situations.
Free Dashboards PowerPoint Slides PPT
Blockchain dashboards slide to help you visualize the financial state of your coin. As cryptocurrency now is a really popular sector, investors need to always see the track the movement of the token they are buying.
Global KPI Scorecard Dashboard PowerPoint template to help monitor and track performance, using such a design makes it easy to reflect on your results. It contains different sections to track soc.
A balanced scorecard PowerPoint template that you can add to your PowerPoint presentation while reflecting on the performance of your team. A minimalistic dashboard design that can be used many times.
Another Dashboard as a tool for tracking and monitoring performance. Using a scorecard dashboard PowerPoint template is a important to your visuals and documentaries.
A couple of tips to help you create a dashboard PowerPoint template! Here is a practical and creative scorecard dashboard PowerPoint template design.
Market effect chart PowerPoint template for a market graph that reflects performance over time. A market dashboard slide helps you reflect on the marketing impact on your business. You will see that it contains for daily, weekly, monthly and annual results.

Introducing this set of slides with name – Project Dashboard With Kpi Status Risks Project Area Issues. This is a four-stage process. The stages in this process are Project Review, Project Analysis, Project Performance management.
Dashboards define the sales or financial activities and the end results that will be performed and how the targets will be accomplished. The use of creative graphic icons offers its users to get a fascinating template.
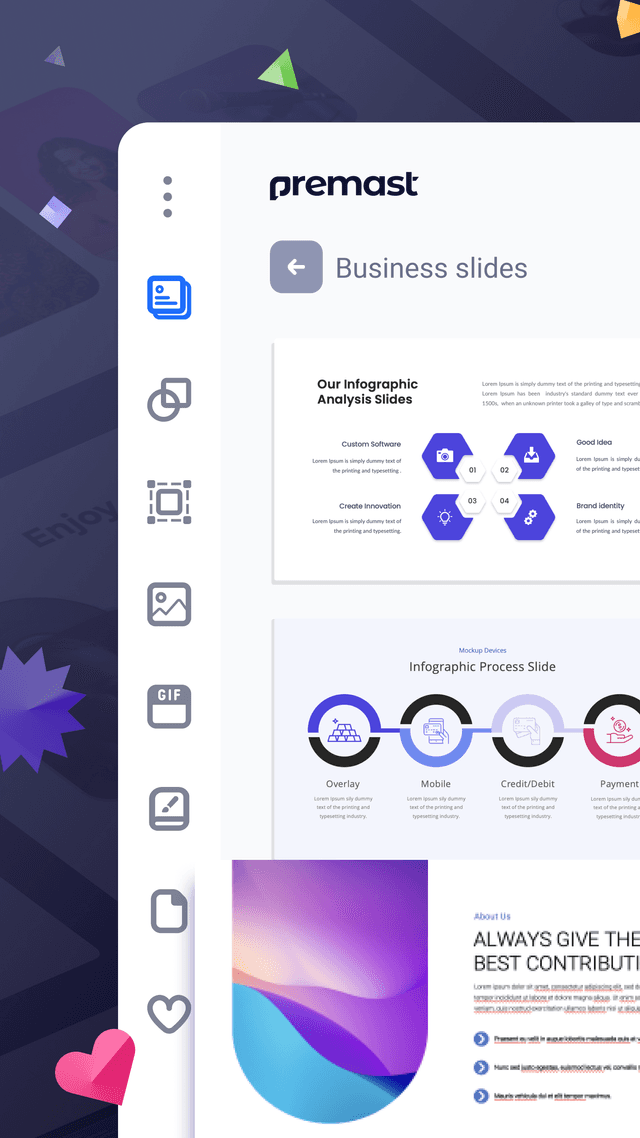
Dashboard Powerpoint Templates are a strong tool that can help you to see the future early, make sense of your information faster, and act to what fits your business and help you develop and grow. PowerPoint gives you access to edit and customize your experiences. You can definitely check our Premast templates for more options.
Spread the word
Start for free.
Design, manage and share your Presentation and branded content
