KPI Dashboard PowerPoint Presentation Template
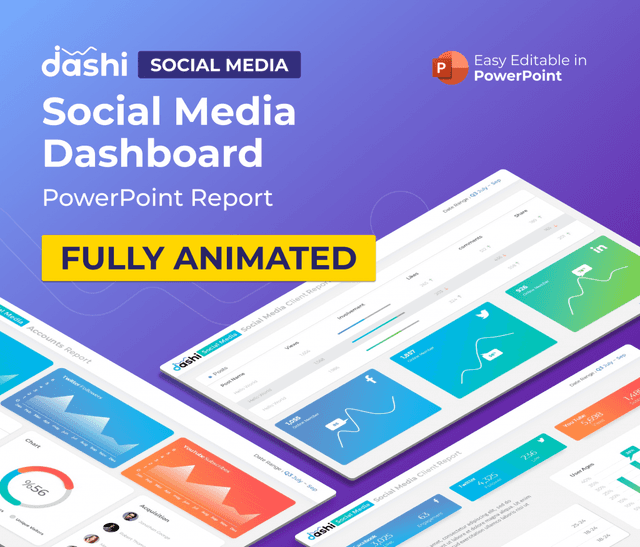
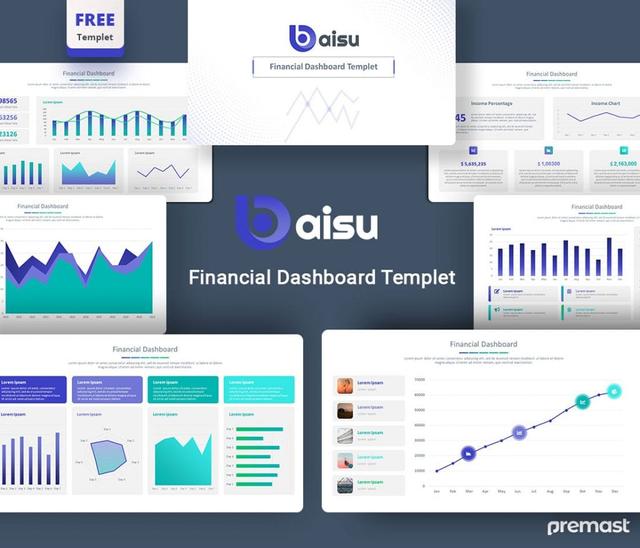
Showcase your business performance with the KPI Dashboard PowerPoint Template—perfect for presenting data-driven insights and growth strategies. Designed for business analysts, managers, and marketers, this template helps you highlight key performance indicators and make impactful decisions.
Start by displaying your company’s growth with visually engaging charts, graphs, and metrics. This template offers slides to showcase sales figures, profit margins, and market analysis, making complex data easy to understand. You’ll also find review slides to track regional sales and conversion rates, giving you a clear overview of your business’s performance. The goal is to make insights easy to interpret and actionable!
Each slide is fully customizable, allowing you to adjust colors, fonts, and visuals to match your brand. Whether you’re presenting to stakeholders, reviewing results, or planning your next strategy, this template keeps your content clear and engaging. Download the KPI Dashboard PowerPoint Template today and create powerful presentations that showcase your business success!
Example of included content:
KPI Growth | Data Insights | Smart Approach | Optimize Metrics | Sales Stats | Market Trends | Profit Margins | Revenue Data | Sales Pipeline | Forecast Chart | Conversion Rate | Regional Sales | Performance Review | Visual Power | Data-Driven | KPI Analysis | Marketing Stats | Annual Growth | Product Sales | Smart Strategy | Company Data | Sales Overview | Financial Goals | Regional Insights | Dashboard Overview | Metrics Review | Business Trends | Key | Indicators | Growth Analysis | Thank You
Features:
30 Total Slides
16:9 Full HD
Designed for Microsoft Powerpoint
Drag & Drop Image (Using Placeholder)
Editable Charts
Using Free Fonts


