See the Big Picture: Why Charts are a Game-Changer in Business Presentations!
In the world of business, effective communication is crucial for success. One of the most important tools in communication is the use of charts in business presentations. Charts help to convey complex information clearly and concisely, making it easier for audiences to understand and retain information. In this article, we will explore the different types of charts that can be used in business presentations and the benefits of using them.
Types of Charts
✔️ Bar Charts

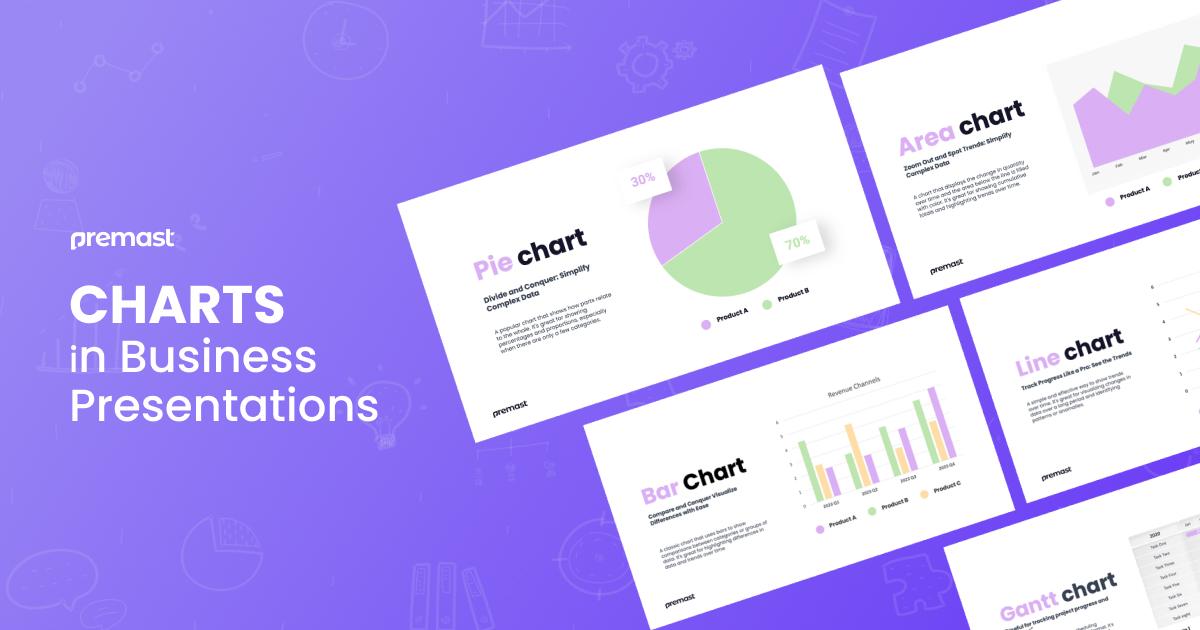
Bar charts are one of the most commonly used types of charts in business presentations. They are ideal for comparing the values of different items or categories. Bar charts are typically presented horizontally or vertically and can display single and multiple data sets. The length or height of the bars corresponds to the values being compared. For example, a bar chart can be used to compare sales figures for different quarters of the year. Explore more charts
✔️ Line Charts

Line charts are ideal for displaying trends or changes over time. They are commonly used to show changes in stock prices, sales figures, or website traffic. Line charts typically have an x-axis that represents time and a y-axis that represents the data being tracked. The line on the chart represents the trend or change over time. Explore more charts
✔️ Pie Charts

Pie charts are useful for displaying data as parts of a whole. They are commonly used to show market share or the percentage of sales from different products or services. A pie chart is a circular chart divided into slices, each representing a different category. The size of each slice corresponds to the percentage of the whole it represents. Explore more charts
✔️ Gantt charts

A Gantt chart is a popular type used in business presentations, particularly in project management. It’s a visual representation of a project schedule that shows the start and end dates of tasks or activities, as well as the dependencies between them. The chart is usually organized by rows, with each row representing a different task or activity, and by columns, with each column representing a different period. This makes it easy to see which tasks are happening simultaneously, which tasks are dependent on others, and how long each task is expected to take. Explore more charts
✔️ Area Charts

Area charts are similar to line charts, but they also show the area between the line and the x-axis. They are useful for displaying changes over time and can be used to show changes in market share, sales figures, or website traffic. Explore more charts

Benefits of Using Charts in Business Presentations
📌 Clear Communication
One of the main benefits of using charts in business presentations is that they help to convey complex information clearly and concisely. Charts are much easier to understand than raw data, making it easier for audiences to follow the presentation.
📌 Visual Appeal
Charts also add visual appeal to business presentations. They break up the text and add color and interest to the presentation, making it more engaging for audiences. Charts can also be customized to match the branding of the company, adding a professional touch to the presentation.
📌 Comparative Analysis
Charts also make it easier to compare different sets of data. For example, a bar chart can be used to compare the sales figures of different products or services. This makes it easier to identify trends and make informed decisions based on the data presented.
📌 Time-Saving
Finally, using charts in business presentations can save time. Instead of presenting raw data, charts can be used to quickly and easily convey information. This allows presenters to focus on the most important points of the presentation, making the presentation more efficient and effective.
In short, When creating a business presentation, it’s important to carefully consider the type of chart that will best convey your message and support your key points. By selecting the right chart and using it effectively, you can ensure that your audience understands the information and is engaged with your presentation.
Overall, charts are an essential tool in the modern business world. By mastering the art of data visualization, you can unlock new insights and opportunities, and take your business to the next level.
YOU MAY ALSO LIKE
Spread the word
Start for free.
Design, manage and share your Presentation and branded content


